Understanding Price Action Trading: Learn Its benefits and strategies


Have you ever wondered how some traders estimate when to buy or sell stocks just by looking at their prices? It is likely that they’re using something known as price action trading. In this article, we’ll take a closer look at everything you need to know about price action trading: what it means, its benefits, and simple strategies that you can start using in your investment journey.
- Table of contents
- What is price action trading?
- What is price action in the stock market?
- Difference between price action, technical analysis, and indicators
- What are some price action trading strategies?
- Different tools used for price action trading
- Benefits of price action in trading
- Mutual funds: An alternative to stock trading
What is price action trading?
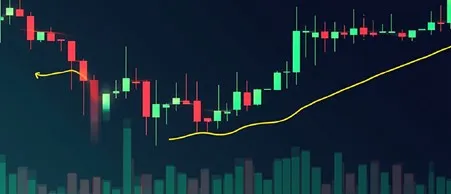
In simple terms, price action trading means making trading decisions based primarily on the price movements of stocks. Traders using price action watch how the price moves, like the highs, lows, and patterns, and make trades based on what these movements suggest might happen next.
When you choose price action trading, you may rely on:
- Candlestick patterns
- Trend lines
- Support and resistance levels
- Price movement patterns (like breakouts or reversals)
What is price action in the stock market?
In the stock market, price action is simply how a stock's price moves up and down during a trading day or over weeks and months. When a stock's price moves, it creates patterns or signals. By understanding these signals, traders seek to predict whether the price might go up or down.
For example:
- If a stock’s price tends to go down after it reaches a market value Rs. 500, traders see Rs. 500 as the resistance level. After this level is reached, the price tends to stall or reverse as selling pressure begins.
- If the price tends not to fall below Rs. 450, that's called a support level. This is the price level where buying interest tends to begin and prices bounce up.
By watching how price behaves around these levels, traders decide when to buy or sell.
Difference between price action, technical analysis, and indicators
Price action and indicators fall under the broader umbrella of technical analysis, which is the overall approach of using past price and volume data to forecast potential future price movements.
- Price action:
- Focuses only on price movements.
- Doesn’t use indicators like moving averages or RSI.
- Clean and simple charts (mostly candlestick charts).
- Technical analysis:
- Uses price patterns and other indicators together.
- Might include moving averages, RSI, volume, and more.
- More detailed and complicated charts.
- Indicators:
- Mathematical tools that use past price data.
- Examples are MACD, Bollinger Bands, Moving Averages, etc.
Read Also: MACD indicator, meaning and how it works in trading
What are some price action trading strategies?
There are several easy-to-understand action trading strategies that beginners can start using. Do note that the success of none of these strategies is guaranteed and depends upon individual skill and market conditions.
1. Support and resistance trading
- Look for areas where the price consistently bounces.
- Buy near support (low price level).
- Sell near resistance (high price level).
- Always confirm these levels by observing repeated price touches; more touches mean stronger support or resistance. This strategy gives you potentially suitable entry and exit points, helping you reduce your risks.
2. Breakout strategy
- A breakout happens when a stock price moves outside the defined support or resistance level, with enough strength, signaling a potential start of a new trend.
- Wait for prices to move beyond (breakout) the resistance or support.
- Buy after a breakout above resistance.
- Sell after a breakout below support.
- Always wait for the breakout to hold for some time to avoid false signals.
3. Trendline trading
- Draw a simple line connecting higher lows (uptrend) or lower highs (downtrend).
- Buy when prices touch the trendline moving upwards.
- Sell when prices touch the trendline moving downwards.
- Trendlines show clear market directions, making it easy to spot buying or selling opportunities in trending markets.
4. Candlestick patterns
- Learn patterns like “Hammer,” “Doji,” or “Engulfing candles.”
- These patterns help in predicting future price movements.
- Always confirm these patterns with support, resistance, or trendlines for stronger trading signals. Candlestick patterns provide easy visual cues that make decisions straightforward, even if you are new to trading.
Read Also: Stock Market Trading: Meaning, Types, and Historical Context
Different tools used for price action trading
The key advantage of price action trading lies in its simplicity. You won’t need complicated tools. Basic tools include:
- Candlestick charts: Clearly show how prices moved during the day.
- Trend lines: Simple lines showing price direction (up or down).
- Horizontal lines: Marking support and resistance levels clearly.
- Fibonacci retracements: Sometimes used to find key levels.
- Volume data: Occasionally helpful to confirm price movements.
These simple tools make it easy for even new investors to understand and use price action trading quickly.
Benefits of price action in trading
Price action trading can be a beginner-friendly approach to entering the stock market. Some of its advantages include:
- Simple and easy: Easy to learn even if you’ve never traded before. You don't need special financial knowledge or advanced software, only basic charts and an understanding of price patterns.
- No confusion: Fewer distractions because you don’t rely on multiple complicated indicators. With fewer things cluttering your charts, your attention remains focused on the price itself, helping you trade with clarity.
- Simple decision-making: Easy to understand why you’re buying or selling. Each trade has a clear reason, such as price touching a support line or breaking through resistance.
- Fast decisions: Quick decisions based on direct price signals. This helps you react promptly, especially when markets move rapidly, ensuring you don't miss trading opportunities.
Mutual funds: An alternative to stock trading
Despite its relative simplicity, price action trading still requires time, knowledge and a dedicated focus on market movements. Investors who prefer a more hands-off approach and want investment experts to handle such decisions may find mutual funds suitable, as they are professionally managed. Fund managers may use price action trading or other technical and fundamental analysis strategies to buy or sell stocks and craft their portfolio.
Conclusion
Price action trading is a simple approach to understanding markets and making trading decisions. Its main advantage is simplicity. You don’t need advanced software or complicated math for it. By understanding price action, beginners in the stock market can make trades with more clarity and knowledge.
FAQs
What are the limitations of price action?
Price action trading may not always be accurate, especially during periods of sudden news or extreme market volatility. It also requires practice and discipline to master.
How can one read price action?
You read price action by looking closely at candlestick charts, observing key patterns, and noting support and resistance levels or breakouts.
Is price action good for swing trading?
Yes, price action can be suitable for swing trading as it clearly shows short-term trends and key reversal points, making it easier to identify trading opportunities lasting days or weeks.
What does price action mean in trading?
Price action in trading means making buy or sell decisions based purely on how prices move, without depending heavily on indicators or other analysis methods.
What is the rule of price action trading?
The main rule of price action trading is to always trade based on clear, simple signals from price movements, using support, resistance, and trendlines, avoiding unnecessary indicators and distractions.
Mutual Fund investments are subject to market risks, read all scheme-related documents carefully.
This document should not be treated as endorsement of the views/opinions or as investment advice. This document should not be construed as a research report or a recommendation to buy or sell any security. This document is for information purpose only and should not be construed as a promise on minimum returns or safeguard of capital. This document alone is not sufficient and should not be used for the development or implementation of an investment strategy. The recipient should note and understand that the information provided above may not contain all the material aspects relevant for making an investment decision. Investors are advised to consult their own investment advisor before making any investment decision in light of their risk appetite, investment goals and horizon. This information is subject to change without any prior notice.
Mutual Fund Investments are subject to market risks, read all scheme related documents carefully.
This document should not be treated as endorsement of the views / opinions or as an investment advice. This document should not be construed as a research report or a recommendation to buy or sell any security. This document is for information purpose only and should not be construed as a promise on minimum returns or safeguard of capital. This document alone is not sufficient and should not be used for the development or implementation of an investment strategy. The recipient should note and understand that the information provided above may not contain all the material aspects relevant for making an investment decision. Investors are advised to consult their own investment advisor before making any investment decision in light of their risk appetite, investment goals and horizon. This information is subject to change without any prior notice.